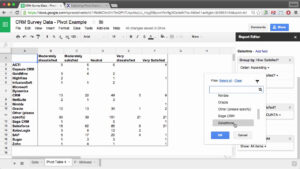
Pivot tables in Google Sheets summarize data. Look for a column of data that has REPEATING information. Use the data menu to choose “Pivot table” and in the sidebar add for “Rows” the column of data that you want to summarize by. Choose the column of data for “Values” in the sidebar for what information you want to show summarized.
Related Posts

Google Sheets: Getting Started
22 May, 2024
Facebook0Twitter0Google PLuse00Shares 2 Views In this video, you’ll learn more about getting started with Google Sheets. Visit https://edu.gcfglobal.org/en/googlespreadsheets/getting-started-with-google-sheets/1/ for our text-based lesson. We hope you enjoy!

Google Sheets: Create Pivot Tables and Charts
5 April, 2024
Facebook0Twitter0Google PLuse00Shares 794 Views A step-by-step example of how to create a pivot table and associated chart in Google Sheets. To visit our Google Workspace blog, click…

Pivot Tables in Google Sheets (learn Fast!): Tutorial
5 April, 2024
Facebook0Twitter0Google PLuse00Shares 785 Views Learn Pivot Tables in Google Sheets in this Tutorial (and do it on your coffee break). Here are the things you will learn…
