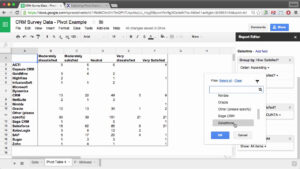
Learn how to create a basic pivot table, starting with the right data and ending with an easy-to-read report. This tutorial will lead you through basic creation, how to fill columns and rows, fill the body of the table with data, and group by date.
🕒 Timestamps:
0:00 Intro
0:33 Start with good data
1:09 Beginning to create
1:49 Make your columns and rows
2:53 Fill the middle with data
3:30 Analyze by date
3:45 Group by year
4:19 Filter by year
5:04 Other filters
Learn more from Prolific Oaktree:
🌳 Next Video – Google Sheets – Create an Interactive Task List – https://youtu.be/cOOrdL_JuF0
🌳 Related Playlist – Google Apps | Full Tutorials – https://bit.ly/google-tutorials
#googlesheets #pivottables #prolificoaktree