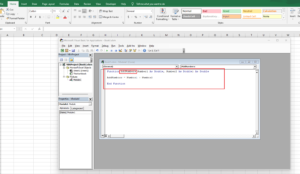
How to Create a User Defined Function in Excel
Creating a User Defined Function (UDF) in Excel using Visual Basic for Applications (VBA) allows you to perform custom calculations beyond the capabilities of built-in Excel functions….
Creating a User Defined Function (UDF) in Excel using Visual Basic for Applications (VBA) allows you to perform custom calculations beyond the capabilities of built-in Excel functions….
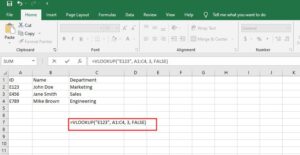
Step 1: Organize Your Data Ensure your data is organized in a table format with columns and rows. The value you want to look up should be…
Create a Gradebook on Microsoft Excel: Make a Weighted Points Grade Sheet Microsoft Excel is a great program for creating simple grade books! Using a spreadsheet (and…
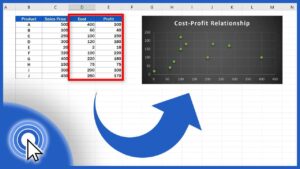
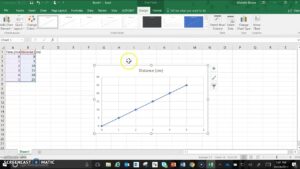
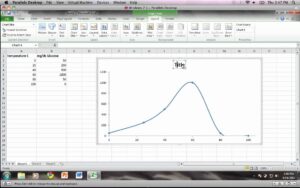
Here we come with another quick and easy video tutorial on how to make a simple scatter plot in Excel, which is useful if you want to…
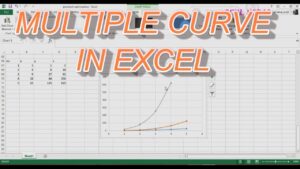
#EXCEL #HowToDrawCurveInExcel This Tutorial is based on excel.
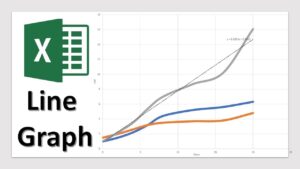
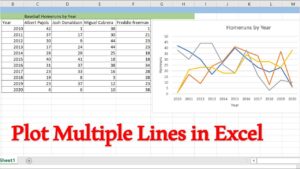
Want more Excel videos? Here’s my Excel playlist: https://www.youtube.com/playlist?list=PLmkaw6oRnRv8lAKbKbflJRqS-9wuYNWUw This video will show you how to make a line graph in excel. Charts are quick to create…
Recorded with http://screencast-o-matic.com
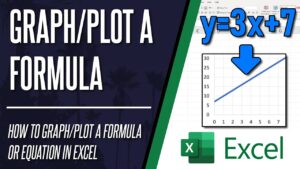
Want to know how to plot a formula on Excel or how to graph a formula on Excel? This video will cover how to plot an equation…
In this video I show you the basics of creating a graph in Microsoft Excel 2010. You can find a collection of my iWork and MS Office…
The purpose of this video is to show how to add up only certain cells in excel by using the Sumif function. The example being used today…