Making a Simple Bar Graph in Excel

From “Introduction to Statistics, Think & Do”
by Scott Stevens, Amazon: https://amzn.to/2zJRCjL

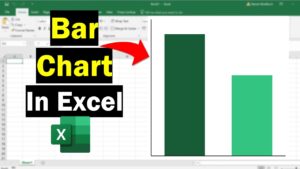
This demonstration shows you how to create a simple bar graph in Excel.

Textbook from Publisher, $29.95 print, $9.95 PDF
http://www.centerofmathematics.com/wwcomstore/index.php/thinkdov4-1.html

Textbook from Amazon: https://amzn.to/2zJRCjL

Textbook Website: http://www.StevensStats.com

Related Posts

How to Make Bar Chart in Excel

How to Make Bar Chart in Excel

Facebook0Twitter0Google PLuse00Shares 6 Views 🔥 Learn Excel in just 2 hours: https://kevinstratvert.thinkific.com In this video, you will learn how to create different types of charts in Microsoft…

Excel Charts and Graphs Tutorial

Excel Charts and Graphs Tutorial

Facebook0Twitter0Google PLuse00Shares 11 Views 🔥 Learn Excel in just 2 hours: https://kevinstratvert.thinkific.com In this step-by-step tutorial, learn how to pull together charts in Excel. Charts are a…

Language »
close
Thanks !

Thanks for sharing this, you are awesome !