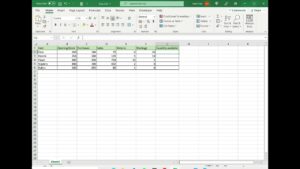
Use Excel to quickly calculate the Mean, Median, Mode, Standard Error, Standard Deviation, Variance, Kurtosis, Skewness, Range, Minimum, and Maximum. This video shows you how to calculate Descriptive Statistics using the Data Analysis Tool in Excel. I also demonstrate how to install the Tool if it is not already on your Excel Ribbon.
If you enjoyed this video please visit my channel page for more videos and please subscribe, I really appreciate it!
YouTube Channel: https://bit.ly/3a7equ0
Related Posts
How to add and subtract multiple cells in Excel
View detailed instructions here: https://spreadcheaters.com/how-to-add-and-subtract-multiple-cells-in-excel/
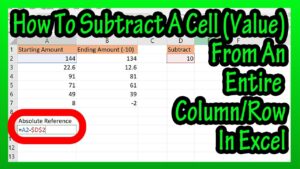
How To Subtract A Cell (Value) From An Entire Column Or Row In Excel Explained – Absolute Reference
In this video we discuss how to subtract a cell, or actually a cell value from a column or row in an excel spreadsheet. We go through a detailed example step by step. Transcript/notes Let’s say that you want to subtract a cell value from an entire column, such as in this example excel spreadsheet,…
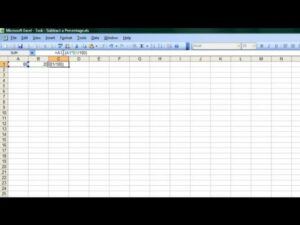
How to Subtract a Percentage in Microsoft Excel : Microsoft Word & Excel
Subscribe Now: http://www.youtube.com/subscription_center?add_user=ehowtech Watch More: http://www.youtube.com/ehowtech Subtracting a percentage in Microsoft Excel is something that is accomplished by comparing the values of two distinct cells in a table. Subtract a percentage in Microsoft Excel with help from a professional programmer, designer, and developer in this free video clip. Expert: Geoph Essex Filmmaker: Victor Varnado Series…